
Charts are where most trading decisions start, so picking the right charting tools is not a small choice. A solid ctrader advanced charting tools example shows you exactly which features matter during live trading, which ones save time during analysis, and how each one maps to a concrete rule you can automate later. If you have spent hours staring at a chart but still find it hard to turn what you see into a repeatable process, this guide walks through the whole picture. AlgoBuilderX was built for traders who start exactly here: strong chart readers who want to convert visual logic into a working cTrader bot without touching a single line of code.

What Makes cTrader Charting Different
cTrader is not just another platform with a candlestick view bolted on. Its charting engine was designed for speed and depth at the same time. Every ctrader advanced charting tools example you find in real trading scenarios relies on a few platform-level strengths that set it apart from generic retail terminals.
First, cTrader gives you tick-level data natively. That means your chart does not round or approximate price movement. Second, it lets you detach, resize, and stack chart windows freely, so multi-timeframe analysis does not require switching tabs. Third, every built-in drawing tool and indicator is attached to the chart engine directly, not layered on top as an afterthought.
These platform fundamentals matter because a good ctrader advanced charting tools example is only useful when the data underneath it is clean. Noisy or lagged data makes even the best tool unreliable.
CTrader Advanced Charting Tools Example by Tool Type
Not all chart tools serve the same purpose. The table below maps the main charting tool categories to their primary use cases, so you can decide which ones belong in your workflow before you start building rules.
Every ctrader advanced charting tools example in professional use combines at least two of these categories. A trend indicator confirms direction; an oscillator confirms timing. That two-layer check reduces false signals significantly.
A Practical CTrader Advanced Charting Tools Example Using EMA and RSI
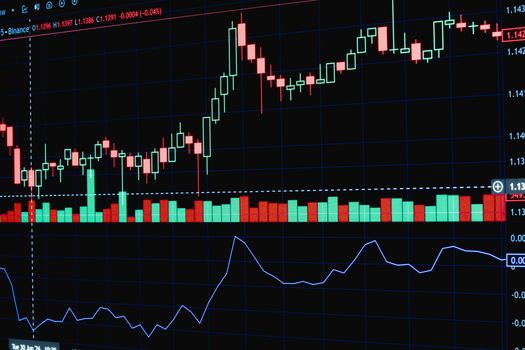
Take this concrete setup: a 20-period EMA on the 1-hour chart combined with a 14-period RSI. The rule is simple. Price must be above the 20 EMA for a long, and RSI must be below 60 but rising. This is a valid ctrader advanced charting tools example because every condition is binary: either price is above the EMA or it is not. Either RSI is below 60 or it is not. Binary conditions are what make a visual idea automatable.
This kind of setup is exactly where many traders get stuck. They can see the logic on the chart but cannot translate it into a bot. That is the gap AlgoBuilderX closes. You describe the conditions using a visual builder, and the platform converts them into a working cTrader cBot automatically.
Reading Charts to Build a Rule-Based Strategy
Moving from chart reading to rule writing is a skill, and most traders underestimate how much precision it requires. A good ctrader advanced charting tools example forces you to define entry, exit, and position size as explicit conditions, not feelings.
Start with one setup. Pick the single chart pattern or indicator combination you use most often. Write the entry condition in one sentence with a number in it. Write the stop loss level as a fixed distance or a reference to a chart point. Write the take profit the same way. If you cannot write it in one sentence, it is not ready to automate.
For a deeper look at how traders convert a manual process into a bot, the guide on migrating a manual forex strategy to a bot covers each transition step in detail. You may also want to read about why cTrader bots lose money, since many of those failures start at the chart-reading stage before automation even begins.
The external resource cTrader’s official indicator library lists every native tool available on the platform, including input parameters and calculation methods. That reference is useful when you need to verify what an indicator actually measures before you build a rule around it.
CTrader Advanced Charting Tools Example in Automation
Once your chart rules are written clearly, automation becomes straightforward. Each ctrader advanced charting tools example you define in writing maps directly to a bot condition. The EMA crossover becomes a trigger. The RSI threshold becomes a filter. The stop loss distance becomes a parameter you set once and never forget to place manually again.
The automation workflow with AlgoBuilderX follows the same logic. You import your strategy conditions, connect them to the charting inputs you already understand, and the platform handles the code generation. There is no need to learn C# or any scripting language. The gap between “I see this on the chart” and “the bot acts on this” closes without a programmer in between.
Photos provided by Pexels.
Automation also forces discipline. When a ctrader advanced charting tools example is running as a bot, it executes every time the conditions are met, not only when you are at the desk or in the right mood. That consistency is often the actual edge, not the strategy itself.
For traders who want to see this process from start to finish with a real person behind it, the case study of a trader who built a bot in one week shows how the chart-to-automation path works in practice.

One thing worth noting: a ctrader advanced charting tools example that works visually on historical data does not automatically become a profitable bot. Backtesting is a separate step, and the results need to be read carefully. But you cannot backtest something you cannot define, so the charting stage always comes first.
The more precisely you define each ctrader advanced charting tools example in your strategy, the more reliable the backtesting output will be. Loose conditions produce loose results. Specific conditions produce data you can actually use to make a decision.
Frequently Asked Questions
What is a good ctrader advanced charting tools example for a beginner trader?
A clean starting point is the EMA and RSI combination described in this article. It uses two widely available indicators, the conditions are binary and easy to write as rules, and it covers both trend direction and entry timing. That makes it one of the most practical ctrader advanced charting tools example setups for traders who are new to strategy automation.
Can I automate any ctrader advanced charting tools example without coding?
Yes, as long as your conditions are specific enough to write as if-then rules. Tools like AlgoBuilderX let you describe those conditions visually and convert them into a working cTrader cBot without writing any code. The key requirement is precision: vague chart observations cannot be automated, but clear numerical conditions can.
Does using a ctrader advanced charting tools example guarantee better trading results?
No tool guarantees results. A ctrader advanced charting tools example helps you build a more consistent and testable strategy, but profitability depends on how well the rules are defined, how thoroughly they are backtested, and whether they hold up under different market conditions. Good charting practice improves your odds by removing ambiguity from your decisions.
Putting It All Together
Every strong trading strategy begins at the chart, and every chart observation that cannot be written as a clear rule is not ready to trade systematically. Working through a real ctrader advanced charting tools example, as this guide has done, is the fastest way to identify which parts of your approach are concrete and which are still intuition. AlgoBuilderX exists to bridge that gap: once your chart logic is clear, the platform turns it into a cTrader bot without any coding required, so you spend less time on implementation and more time refining the strategy itself.
Ready to try this yourself?
AlgoBuilderX helps you put this into practice, without extra busywork.